Page 1. Start Analysis
If the titration curve is pasted into the active grid, enter experimental parameters and click Calculate Q. The titration curve will be converted to the binding isotherm Q.
After data are entered, click Calculate pK distribution to initiate the analysis.
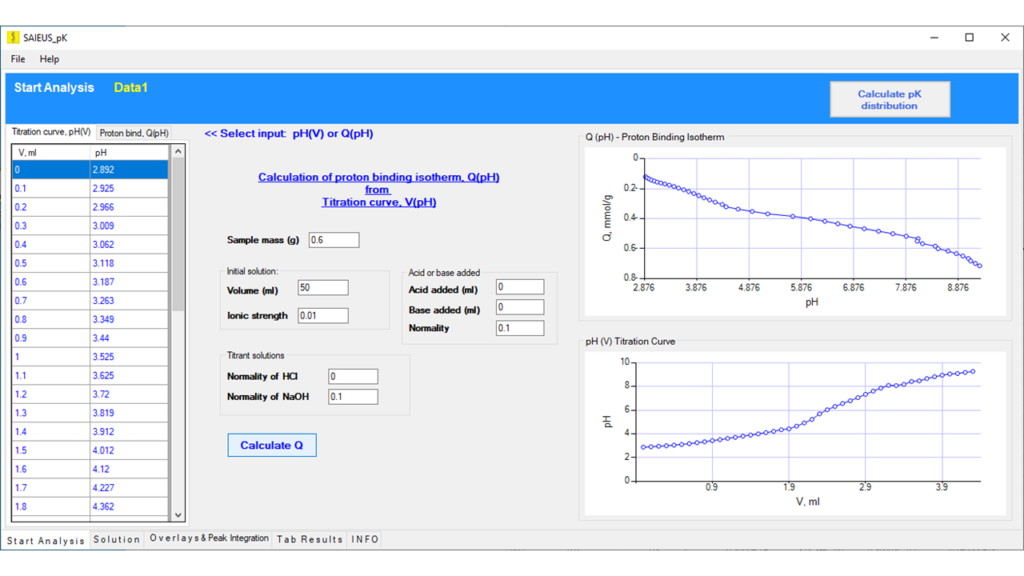
Grid Page 1: Paste titration curve pH (V)
Grid Page 2 : Paste proton binding isotherm, Q (pH)
Page 2. Solution
The initial solution applies an initial guess for Lambda parameter based on the L-curve and Fitting error analysis. The user can interactively select other Lambda values to see the effect on the pK distribution and fit.
File (MENU):
Save results as… >> Save results files to be used for overlays.
Export CSV >> Generate CSV file.
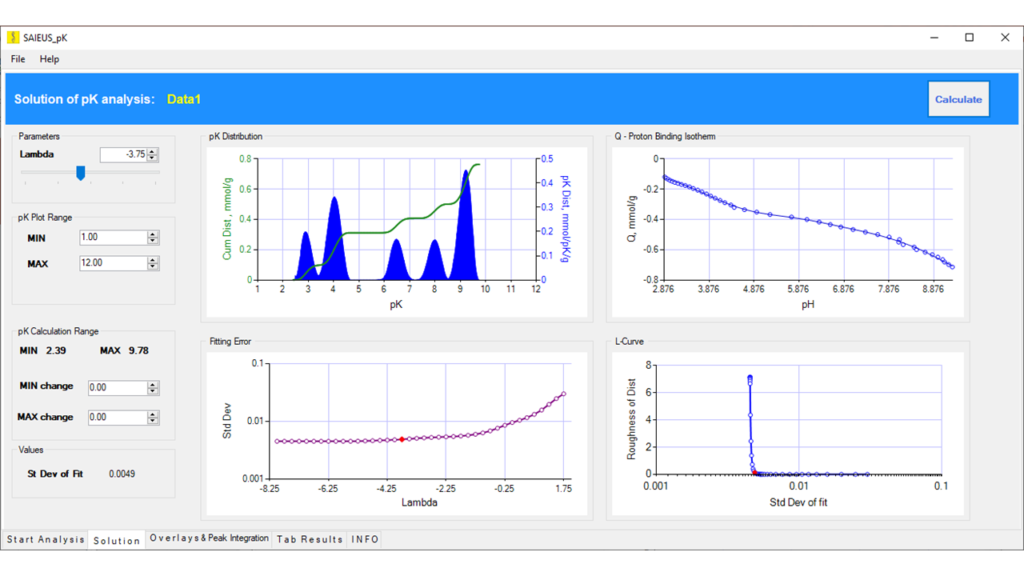
Interactive change of Lambda. Interactive change of pK plot range. Interactive change of pK calculation range.
Page 3. Overlays & Peak Integration
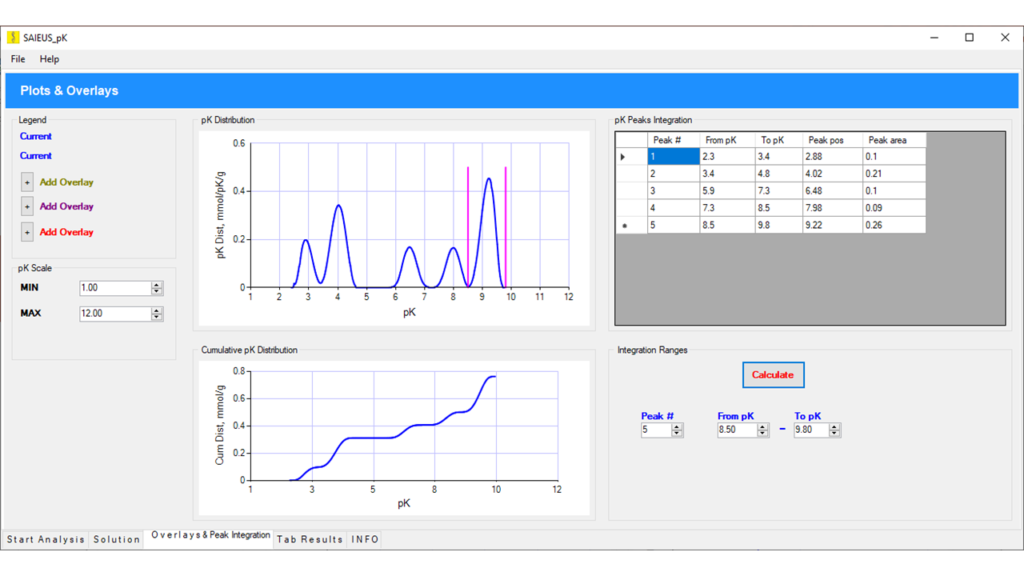
Overlays of previously saved results.
Integrate peaks in the interactively selected pK ranges.
Display table of the integration results and peak positions.
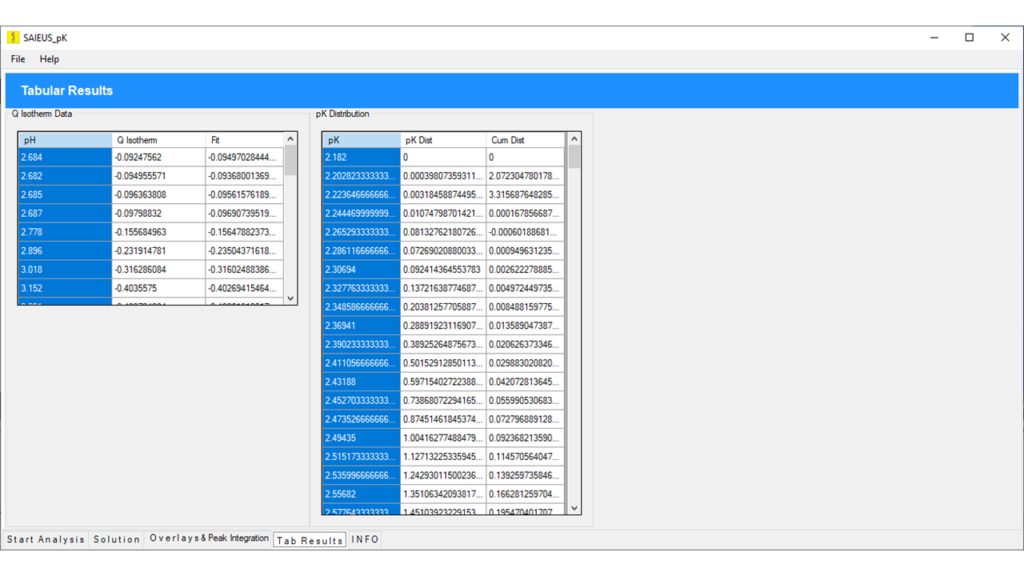
Page 4. Tab Results
View numerical results.
Select columns >> Copy to clipboard.