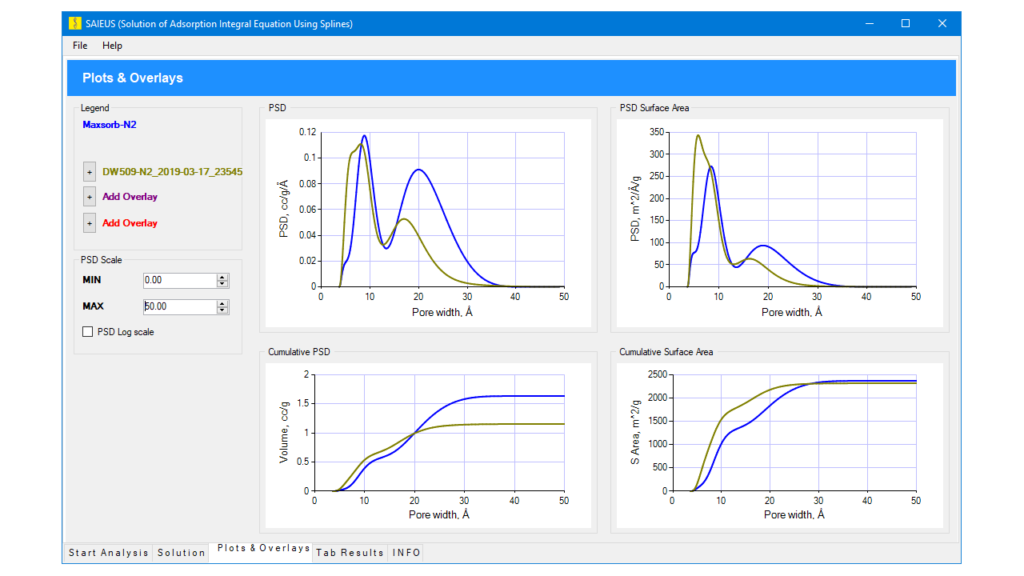
Complete PSD analysis results are displayed here as:
-Differential Volume and Surface Area
-Cumulative Volume and Surface Area.
Up to three previously saved plots can be added to each chart. This page allows comparing the results for different samples and/or different calculation parameters.